I have just jumped on the train from Linköping, Sweden, heading south, and this train ride marks the beginning of an intensive 4 week travelling period, entailing 4 conferences, 6 conference presentations, and numerous visits to groups all across Europe. If you want to catch and meet us along the way, read on below! Figure 1: Just as in an earlier blog post, I am writing this blog post on the train. This time, I have an interrail ticket and some of my favorite cheeses in front of me!
My first journey heads down to London, where I will attend a workshop on September 14-15 I just very recently discovered: “Accelerating the acceptance of mathematical models as evidence in safety and efficacy decision making”. Apart from some individual exception, this will be a mostly new society of scientists I haven’t interacted with before, but the topic is one that lies close to my heart: how to incorporate mathematical models in drug development and certification. As some of you may know already, we work closely together with AstraZeneca, who also finance a position in my group, on exactly this topic. At the meeting, I am looking forward to hearing more about the Padova diabetes simulation engine (which we have used as a basis for our multilevel type 2 diabetes models), and about modelling for cardiac safety assessments. Both of these are examples where modelling as a replacement for test animals has gone a long way, and it will be nice to hear some updates, and to hear what else has happened in this field recently. This will be the only workshop where neither me nor somebody from my group presents with an oral presentation, and the reason for that is that I signed up only a few days ago, when the programme was already set.
 Figure 2: This a picture from the event that in many ways can be seen as the inaugural event of my group: ICSB in Stanford 2009. Since then we have gone to almost all of the ICSB conferences.
My second journey continues on south, down to Barcelona and the International Conference of Systems Biology (ICSB), which is held September 16-20. ICSB (link) is the biggest annual conference in the field, and since it is the first time in a few years that the conference is held in Europe, it is important for us attend. The conference is arranged by the International Society for Systems Biology, headed by Hiroaki Kitano, who also was a guest professor in my group for a few years. We will go there quite a few of us from our group – me, William Lövfors, Elin Nyman, Sebastian Sten, Karin Lundengård, and Johanna Fridberger – and then there are anyway 3 people who intended to go but ended up not going (Maria Engström, Hao Li, and Rikard Johansson). At this conference, many people will be familiar faces, and we are looking forward to meeting both them and new scientists. At this conference we will also give two oral presentations:
1) Karin Lundengård with the presentation: “A mechanistic model for investigating the biological mechanisms behind fMRI“. This is based on our published model for describing the BOLD response in fMRI, and also goes into how it can be used to more correctly and precisely estimate neural activity. The presentation is held 12.15-12.35 on the Monday, in Hall 5.
2) William Lövfors with the presentation: “A phosphoproteome-wide mechanistic model of insulin signaling“. This is the updated version of the story already described in a previous blogpost, and it is held on Sunday 17.35-17.55 in the Auditorium.
 Figure 3: The loggo of the Virtual Physiological Human conference.
The third conference is the Virtual Physiological Human (VPH) conference, held in Amsterdam September 26-28. This is a bi-annual conference devoted to multilevel modelling of biomedical, and often even biomechanical, systems. The VPH community is headed by the new director Adriano Henney, who also leads the Avicenna Alliance and is/was the Speaker of the german systems biology network “The Virtual Liver Network”. Before that, the VPH grew out of successful lobbying on the EU level to create a European version of the Physiome project, which e.g. pioneers the multilevel biomechanical and bioelectrical models for the heart. We will go to this conference for the second time, and our troup this time includes me, Rikard Johansson, Tilda Herrgårdh, Hao Li, and Tim Beishuizen. Originally, Elin Nyman also intended to go, but she will already have left for Boston by then. For this reason I will take her oral presentation, and thus give two lectures, along with a third presentation given by Rikard Johansson:
3) Markus Karlsson/Gunnar Cedersund “Meta-modelling combined with non-linear mixed-effects modeling for fast and robust estimation of biomarkers for diffuse liver disease”, Monday September 26, 14.20-14.40 in Emmazaal
4) Rikard Johansson “Model predictive glucose control in intensive care:
assessment in realistic clinical conditions”, Monday September 26, 15.40-16.00 in Emmazaal
5) Elin Nyman/Gunnar Cedersund, “The Virtual Adipocyte – from Big Data to
simulations of human disease”, Wednesday September 28, 09.40-10.00 in Emmazaal Figure 4: My first slide, which I added just before holding my presentation at the last edition of ISGSB, in Durham, UK, 2014. Then I had noticed that the ISGSB has something that I really like: lots of social events, and informal activities, and a very relaxed and open athmosphere that really makes people get to know each other. The man down to the right is Stefan Schuster, who is the main arranger of this year’s edition. However, even though he was a part of the competition last year, I am not sure he has picked up on the idea for this year’s event. Nevertheless, an informal music session is on the programme, and they do have a grand piano there, which I plan to make use of!
The fourth and final conference planned to be a part of this conference is the International Study Group for Systems Biology (ISGSB), in Jena, October 4-7. There I (Gunnar) am an intricate part of the arrangements, since I am part of the ISGSB board, and since many decisions are taken jointly by this board. We are going also to this event (link) for the second time, and we will be a troup of 3 people: me, William Lövfors, and Sebastian Sten. Here Sebastian will give our final lecture for this tour:
6) Sebastian Sten, “Investigating hypotheses describing the negative brain responses in fMRI using a systems biology approach”, Friday October 7, 10.25-10.50.
Finally, and perhaps most importantly, I, Gunnar, will travel between all of these conferences by train, and will stay in Europe this entire period. In other words, I plan to visit quite a few research groups, and discuss projects and possibly also give some more lectures in local seminar series. If you are interested in meeting up with me either at one of the above events, or in between some of them, send me an email at gunnar.cedersund@liu.se . I will probably mostly be in France, England, and the Netherlands between September 20-28, and then in Germany and Austria between September 29 and October 7. But even that may be flexible to some degree!
I am looking much forward to this new travelling period, and I am looking forward to meeting many of you – colleagues and friends – at various places along the way!
Spara
 Figure 1: Front page of my presentation earlier today.
  Figure 2: The difference between the new way of calculating EC50 values (black) with the old one (red).
 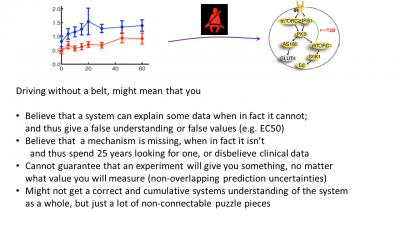 Figure 3: Last page in the presentation, summing up the main advantages of doing modelling, i.e. pointing out some of the drawbacks of not using it.
  Figure 4: On the train on the way back, I happened to be seated right next to a very nice systems biology colleague of mine: Adil Mardinoglu. He told me that he and some colleagues of him had read my last blog post, and wanted to contact me about it. So that is actually the reason why I got inspired to write a new one as well!
  A graphical depiction of the model of all added proteins. The old model we had previously developed is depicted in yellow, all proteins that are connected by high-confidence interactions (3 or more references) are depicted in dark blue, and all proteins reached using one or several low-confidence interactions are depicted in light blue. All proteins can describe time-course data.
  Picture of William, also used on his
  Figure 1: Outline of the first part of the travel.
 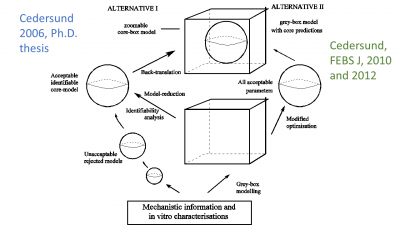 Figure 2: The methods we have developed, first in the thesis of Cedersund (left), and then by their application in end-usage projects (right). The idea is to combine a mechanistically detailed grey-box model (the box), with a well-determined core, a combination we refer to as a core-box model, which also is our group logo.
  Figure 3: Our multi-level model for insulin signalling and the induction of insulin resistance (red T2D inhibition of the green feedback signal), which also propagates to the whole-body level.
 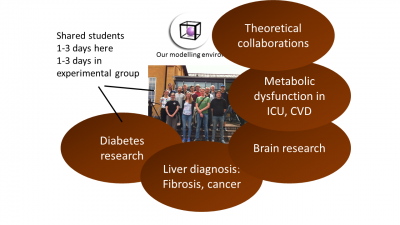 Figure 4: Our group structure, we are in the middle, and our collaboration partners, providing data and biological expertise have a shared environment with us, in terms of shared students, who sit partially with us, and partially in the experimental environment.
  Figure 5: Examples of other application areas, where we combine magnetic resonance imaging data from the brain (A) or the liver (B), with mechanistic models (green below), to identify model properties which serve as new biomarkers. These biomarkers are combining the information in the data with the prior process understanding, and typically outperform existing biomarkers, in terms of providing a correct diagnosis and patient stratification.
 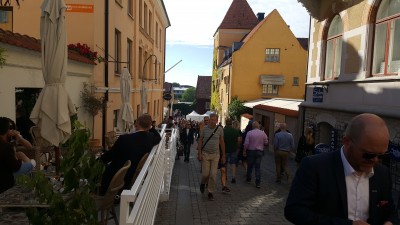 Figure 6: People walking around in the relaxed athmosphere that is Almedalen: on this streets you are equally likely to encounter a top politician as a top scientist, a business leader or an environmental activist or a journalist. They are all active, and all guests and participants in this exciting event.
 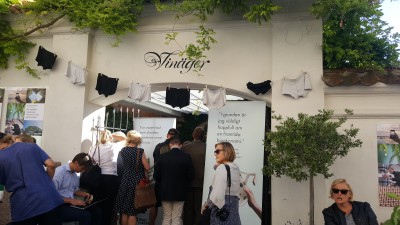 Figure 7: A little bit further down the same street, I encountered one of the many many small little sessions. Most sessions feature 1-6 lecturers, and between approx 15-150 people in the audience. This allows for informal and many parallel sessions, where one can dive into in-depth and meaningful discussions. In total more than 3000 events are held during the 8 day event, and the events are spread out all across the biggest city of Gotland, called Visby.

 TITLE AND ABSTRACT